Industrial Downtime Statistics: What Each Number Actually Measures
What are the key industrial downtime statistics?
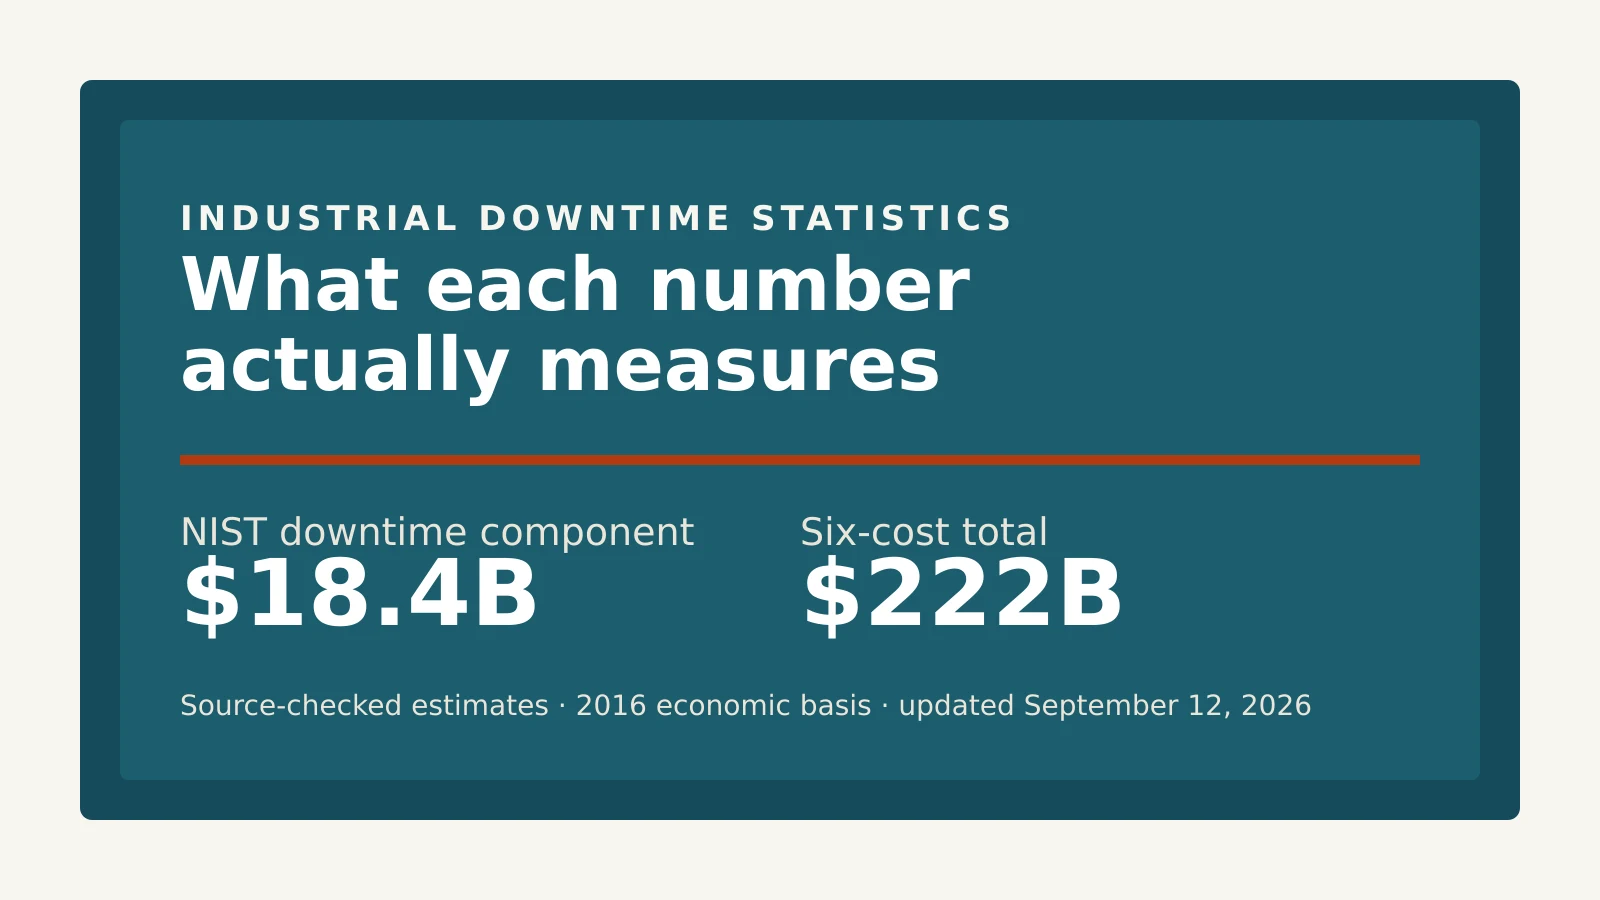
NIST's unplanned downtime component is $18.4 billion, not the $222 billion total it sits inside—both are 2016-basis estimates for the study's covered U.S. manufacturing industries. Each statistic below keeps its own figure, year, population and named source. 2
NIST's maintenance-associated unplanned downtime estimate for U.S. discrete manufacturing is $18.4 billion a year, not $222 billion. The $222 billion is the total of six maintenance costs and losses, of which downtime is one. Both are 2016-basis model estimates for NAICS 321–339 excluding 324 and 325, reported in Thomas and Weiss's 2021 journal article, Table 5. 2
Approximately 85.6% of the $28.4 billion gap between NIST's two published totals sits in one line: direct maintenance costs. Direct maintenance moves from $57.3 billion to $81.6 billion between the 2020 point estimate and the 2021 Monte Carlo mean; unplanned downtime moves $0.3 billion. Our calculation compares analytical estimates for the same covered U.S. manufacturing industries on a 2016 economic basis—not a change in the economy. 1 2
NIST reports 7.8% of planned production time lost to downtime and 31.7% of downtime attributed to reactive maintenance in Table 5.1 of its 2020 report, using responses from its U.S. manufacturing survey on a 2016 basis. Multiplying those two published averages gives about 2.5%; that is an illustrative calculation, not a separately measured national downtime rate. The underlying survey retained 71 respondents. 1 2
NIST's 2021 simulation gives 10.38% downtime for the more-reactive half of its U.S. manufacturing sample and 4.91% for the less-reactive half—52.7% lower relative to the more-reactive group, using the study's 2016 inputs. The authors call these small-group comparisons anecdotal; they are associations, not a measured effect of changing maintenance strategy. 2
Facilities represented in L2L's 2025 U.S. survey averaged 30 hours of total downtime a month, more than half unplanned. The survey covered more than 600 manufacturing leaders across 46 states, fielded July 23–August 12, 2025. L2L states 95% confidence and a ±4% margin of error for the survey; the release does not provide a confidence interval for the 30-hour mean. 7
Six in ten companies reported more than $250,000 a year in excessive downtime costs in L2L's July–August 2025 survey of more than 600 U.S. manufacturing leaders across 46 states. This is prevalence above an annual cost threshold, not the average cost per company. 7
52% of respondents said downtime prevents their organisations from meeting production or shipping targets, and 67% described their maintenance approach as reactive, in L2L's July–August 2025 survey of more than 600 U.S. manufacturing leaders. Neither percentage measures the share of production lost. 7
Siemens' 2024 report puts average unplanned downtime at 27 hours a month for a large plant, with 25 incidents a month. Its methodology describes 181 completed interviews overall, with survey results covering April 2019–March 2023 in four global sectors: automotive, fast-moving consumer goods, heavy industry, and oil and gas. 11
Siemens' $2.3 million per hour is a large-automotive-plant cost estimate, not a manufacturing-wide hourly average. The 2024 report draws on 181 interviews across four global sectors covering April 2019–March 2023; it does not identify $2.3 million as a hard ceiling or the maximum individual survey response. 11
44% of 3,600 global senior decision-makers reported equipment-related interruptions at least monthly, and 14% reported them weekly, according to ABB's October 14, 2025 release. The 14% sits inside the 44%; do not add them. Fieldwork dates are not stated in the release. 12
U.S. manufacturing capacity utilization was 76.0% in July 2026, 2.2 percentage points below its 1972–2025 average of 78.2%, in the Federal Reserve's August 18, 2026 release. This preliminary, seasonally adjusted output-to-capacity ratio is not a downtime rate: normal downtime is already allowed for in sustainable capacity. 5 17
Census publishes Quarterly Survey of Plant Capacity Utilization estimates across 93 industry groups, according to its program documentation checked September 12, 2026. Form MQ-C2 asks plants producing below full capability to select reasons including equipment limitations; the Federal Reserve Board and Defense Logistics Agency co-sponsor the survey. 6
NIST's 2020 report prints an inventory-cost estimate of $0.9 billion beside a 90% confidence interval of $1.3–$5.6 billion; the 2021 article's corresponding table prints $0.3–$1.1 billion. Both refer to the same 2016-basis U.S. manufacturing point estimate. Our source comparison preserves the discrepancy rather than silently choosing a corrected interval. 1 2
NIST retained 71 manufacturing survey responses from 85 returned questionnaires for the analysis behind its 2020 and 2021 publications. The 2021 article describes the screening in its data section; its national estimates use a 2016 economic basis, not 71 directly observed national totals. 2
North Carolina had 449,300 manufacturing jobs in July 2026, down 2.2% over twelve months, according to BLS's North Carolina Economy at a Glance table extracted September 11, 2026. These preliminary, seasonally adjusted employment figures describe industrial footprint, not downtime. 8
Greensboro Dock Door Repair Research Last verified: September 12, 2026
NIST's $222 billion is not a downtime figure. It is the total of six separate maintenance costs and losses. NIST's own maintenance-associated unplanned downtime component is $18.4 billion, about one dollar in twelve of that total, covering the study's U.S. discrete manufacturing industries on a 2016 economic basis. We opened both NIST publications and rebuilt the six components side by side. This page gives you the published downtime figures examined here with their origin document, sample size where disclosed, reference period, and the thing each one does not say. 1 2
Where are the figures, tables and source notes?
The section links go straight to the relevant figures and explanations. Every numbered table and opening statistic has a permanent anchor on this page.
Jump to any section: The headline finding · Why NIST's two totals differ · What an hour of downtime costs · How much downtime plants actually have · The federal record · Which figures can be compared · North Carolina and Guilford County · Why this matters now · Methodology · Limitations · Figures we could not verify · How to cite this page · Download the dataset · FAQ · Sources
Tables: Table 1 — NIST component reconciliation · Table 2 — Confidence intervals that changed · Table 3 — Cost figures and what each measures · Table 4 — Downtime by maintenance strategy · Table 5 — Hours and frequency · Table 6 — Federal source map · Table 7 — QPC reason list · Table 8 — Comparisons the evidence does not support · Table 9 — North Carolina context
Why is $222 billion not a downtime number?
NIST's $222.0 billion total measures six maintenance costs and losses at once, and unplanned downtime is the third-largest component at $18.4 billion. Both are annual estimates on a 2016 economic basis for NAICS 321–339 excluding 324 and 325; calling the larger total a downtime cost substitutes a number about twelve times as large. 2
NIST estimates that maintenance costs and preventable losses in the covered U.S. discrete manufacturing industries total $222.0 billion a year on a 2016 economic basis. Unplanned downtime is one of six components inside that total, and it comes to $18.4 billion. The largest component is lost sales at $105.0 billion, followed by direct maintenance costs at $81.6 billion. Those are different categories of costs and losses, not alternative estimates of the same outage bill. 2
The distinction is in the source table, not just in the report's title. Direct maintenance expenditure, inventories, defects and lost sales do not become downtime merely because they appear in a maintenance study. The $222 billion total cannot be lifted out of that table and relabeled without changing what NIST estimated. The component table below keeps the categories visible. 2
There is a second, separate problem. NIST publishes another downtime dollar figure—$245 billion for discrete manufacturing, attributed to its Manufacturing Cost Guide and repeated in its manufacturing-economy annual reports, including the 2025 edition published in February 2026. That passage uses the same NAICS range but does not establish equivalence to the $18.4 billion estimate. The $18.4 billion values maintenance-associated unplanned downtime against labour, capital depreciation and energy. The annual-report passage puts $245 billion beside 8.3% of planned production time but does not provide a calculation reconciling it with the maintenance-survey estimate. We have not reconstructed that bridge, and we are not going to pretend otherwise. Neither the annual report's publication year nor the tool citation establishes a 2026 measurement. 1 2 3 4
The figure with its scope: NIST's maintenance-associated unplanned downtime estimate is $18.4 billion a year (2016 basis, U.S. NAICS 321–339 excluding 324 and 325), not the $222 billion total it sits inside. 2
Why do NIST's two totals differ by $28.4 billion?
NIST's 2020 report and 2021 journal article publish two sets of maintenance cost estimates on a common 2016 economic basis. The later analysis varies stratification and other inputs through 10,000 Monte Carlo iterations; its mean total is $28.4 billion above the earlier unstratified point estimate. Approximately 85.6% of that gap sits in a single line, and it is not downtime. 1 2
Table 1 — NIST's six components, both publications, same 2016 basis
All figures in billions of 2016 U.S. dollars. Coverage is NAICS 321–339, excluding 324 and 325.
| Component | 2020 point estimate | 2021 Monte Carlo mean | Difference |
|---|---|---|---|
| Direct maintenance costs | $57.3 | $81.6 | +$24.3 |
| Additional costs due to faults and failures | $16.3 | $15.7 | −$0.6 |
| Inventory costs associated with maintenance | $0.9 | $0.8 | −$0.1 |
| Unplanned downtime costs | $18.1 | $18.4 | +$0.3 |
| Lost sales due to maintenance issues | $100.2 | $105.0 | +$4.8 |
| Losses due to defects | $0.8 | $0.5 | −$0.3 |
| Total costs and losses | $193.6 | $222.0 | +$28.4 |
Source: NIST Advanced Manufacturing Series 100-34 (2020), Table 8.1, printed page 39; Thomas and Weiss, International Journal of Prognostics and Health Management (2021), Table 5, printed page 8. Differences calculated by Greensboro Dock Door Repair Research. Verified September 12, 2026. 1 2
The arithmetic on the headline share:
(81.6 − 57.3) ÷ (222.0 − 193.6) × 100 = 85.6%
Two things that finding is not. It is not evidence that maintenance costs rose—both estimates describe 2016. And it is not an explanation of why the later analysis produced a higher figure: NIST's direct-maintenance simulation runs from $36.7 billion to $205.4 billion, with a median of $74.4 billion below its $81.6 billion mean. That minimum-to-maximum span describes simulation results, not observed company costs or a confidence interval. We are reporting where the difference sits, not why. 2
The component differences sum to $28.4 billion. Dividing the $24.3 billion direct-maintenance difference by that total gives 85.563...%, rounded to 85.6%. The negative component differences remain negative; they offset some of the positive changes. All calculations use the precision printed in the publications, not unreported respondent-level values.
Dataset files: component reconciliation, CSV · combined data and formulas, JSON.
Two types of source discrepancy anyone quoting the detail should know about
We read both tables line by line. The confidence intervals and two capital-depreciation labels do not line up throughout the publications. These are source discrepancies to disclose, not permission to substitute an interval or label that happens to look more plausible. 1 2
First: the confidence intervals differ between publications. The 2021 article reprints the 2020 point estimates in its Table 4, but three intervals differ from those printed in the 2020 report's Table 8.1. The table below transcribes both versions; it does not designate either version as an agency-issued correction. 1 2
Table 2 — 90% confidence intervals that differ between the two NIST publications
Billions of 2016 U.S. dollars.
| Line item | NIST AMS 100-34 (2020), Table 8.1 | IJPHM article (2021), Table 4 |
|---|---|---|
| Costs (subtotal) | $50.8–$103.3 | $49.8–$98.8 |
| Inventory costs | $1.3–$5.6 | $0.3–$1.1 |
| Total costs and losses | $94.7–$300.7 | $93.6–$296.2 |
Source: NIST AMS 100-34 (2020), Table 8.1, printed page 39; Thomas and Weiss, IJPHM (2021), Table 4, printed page 7. Comparison by Greensboro Dock Door Repair Research. Verified September 12, 2026. 1 2
The inventory row is the clear one: the printed $0.9 billion estimate is outside the printed $1.3–$5.6 billion interval. The 2020 body text puts its inventory estimates between $0.8 billion and $0.9 billion, but that does not independently establish which confidence interval is correct. A further discrepancy occurs within the 2020 report: the text beneath Table 5.1 gives the $18.1 billion downtime total a 90% interval of $9.4–$29.5 billion, while Table 8.1 gives $10.4–$27.8 billion. The 2021 narrative also attaches $50.8–$103.3 billion to direct maintenance, while its Table 4 gives that component $42.4–$72.2 billion. An interval needs its exact table or passage attached; this page does not silently resolve those conflicts. 1 2
Dataset file: published confidence-interval comparison, CSV. Its notes preserve the additional within-publication conflicts alongside the three cross-publication rows.
Second: two component labels appear transposed. The 2020 report's Table 8.1 prints building depreciation at $2.5 billion and machinery depreciation at $1.0 billion. Its Table 5.1 assigns $2.5 billion to machinery and $1.0 billion to buildings, consistent with the corresponding body discussion. The 2021 article's Table 4 repeats the summary-table labeling. The arithmetic is unaffected—labour $13.5 billion, the two capital components $2.5 billion and $1.0 billion, and energy $1.1 billion sum to $18.1 billion—but quoting an individual capital component requires stating which table's label is being used. 1 2
Neither discrepancy changes our subtraction of the published headline point estimates and Monte Carlo means. Neither justifies treating every detailed interval or component label as settled. The comparison remains useful because the unresolved source details are visible beside the arithmetic, rather than repaired without an erratum. 1 2
What does an hour of industrial downtime cost?
There is no single defensible hourly average for all industrial facilities in this evidence collection. The published figures include ABB's respondent cost bands, a median of self-estimates, Siemens' large-automotive-plant estimate, and national annual models—not interchangeable observations. The sorting question is not just how big the number is, but what population, unit and method produced it. 1 2 11 12 13
Table 3 — Published downtime cost figures and what each one actually measures
| Figure and status | Publisher and type | Publication / period | Method | Sample | What it measures | What it does not say |
|---|---|---|---|---|---|---|
| $18.4bn annually | NIST authors — federal research | 2021; 2016 economic basis | Survey scaled with Census data; Monte Carlo simulation | 71 retained respondents overall | Maintenance-associated unplanned downtime valued against labour, capital depreciation and energy | Not hourly; covered NAICS 321–339 excluding 324 and 325 2 |
| $18.1bn annually | NIST — federal agency | 2020; 2016 economic basis | Unstratified survey-based point estimate | 71 retained respondents overall | The corresponding downtime-cost component before the later simulation analysis | Same industry exclusions; not a 2020 measured loss 1 |
| $245bn downtime estimate | NIST Manufacturing Cost Guide, restated in AMS 100-76 | February 2026 report; economic reference year not specified in the cited passage | Guide-derived figure; no bridge to the $18.4bn estimate given in that passage | Not stated for this figure in the passage | Downtime estimate presented alongside 8.3% of planned production time | Do not label 2026 measured losses or assign an unverified economic year 3 |
| Approximately $1.4 trillion annually | Siemens / Senseye — vendor research | 2024 report; survey results April 2019–March 2023 | Survey plus extrapolation using public plant and employment data | 181 completed interviews overall | Modeled aggregate for the world's 500 biggest companies | Not a survey of 500 companies; not U.S.-only or a small-plant estimate 11 |
| $2.3 million per hour | Siemens / Senseye — vendor research | 2024 report; same survey period | Survey-informed sector cost estimate | 181 interviews across all four sectors, not an automotive-only count | Estimate for a large automotive plant | Not a universal hourly average; not identified as a hard ceiling 11 |
| Approximately $125,000 per hour, median | ABB / Sapio Research — vendor research | October 2023 release; July 2023 fieldwork | Median of questionnaire-based cost estimates | 3,215 plant maintenance decision-makers across 11 sectors | What surveyed decision-makers estimated an hour of downtime would cost | Not an accounting-record audit or a measured universal loss 13 |
| 83% estimated at least $10,000/hour; 76% up to $500,000/hour; 7% above $500,000/hour | ABB / Sapio Research — vendor research | October 14, 2025; fieldwork dates not disclosed in release | Survey of self-estimated hourly costs | 3,600 global senior decision-makers | Percentages in publisher-reported cost thresholds/bands | The $10,000–$500,000 span is not the full response range 12 |
| More than $250,000 annually, reported by six in ten companies | L2L — vendor research | 2025 dateline; July 23–August 12, 2025 fieldwork | Respondent survey; publisher states 95% confidence and ±4% | More than 600 U.S. manufacturing leaders, 46 states | Prevalence above an annual excessive-downtime cost threshold | Not an average; no cost-mean confidence interval in the release 7 |
| More than $300,000/hour for over 90% of midsize and large enterprises | ITIC — IT research publisher | 2024; fieldwork November 2023–mid-March 2024 | Respondent estimates in a web survey | More than 1,000 firms worldwide overall | IT and server/network downtime, not a plant-equipment survey | Kept as an IT comparison; not a manufacturing hourly benchmark 14 |
| $260,000/hour claim — excluded | Attributed to Aberdeen; origin not retrieved | Date not verified in an original source | Not verified | Not verified | No empirical measure accepted here | No verified population, average calculation or age is asserted |
| $5,600/minute claim — excluded | Attributed to Gartner; origin not retrieved | Date not verified in an original source | Not verified | Not verified | No empirical measure accepted here | Not converted into an accepted manufacturing hourly cost |
| 5%–20% productive-capacity assertion — excluded as an empirical benchmark | ISA Interchange article, now on Automation.com | November 22, 2011 | Assertion without a cited supporting study or calculation | No supporting study sample given | The claim can be located in the article | Verified publication of an assertion is not verification of an empirical range 16 |
Source: publisher reports and releases for the verified rows: NIST 1 2 3, Siemens 11, ABB 12 13, L2L 7, and ITIC 14. The last three rows are explicitly excluded benchmarks, not verified industrial cost estimates. Verification pass: September 12, 2026.
Why published cost figures differ so much
Four distinctions explain why these figures cannot be collapsed into a single average. They are a reading framework for the sources, not a measured decomposition of how much each difference contributes.
Different denominators. NIST values its maintenance-associated downtime component against labour, capital depreciation and energy. ABB asks respondents about estimated costs, and L2L reports whether annual costs exceed a threshold. Annual totals, hourly estimates and percentages of companies above a threshold do not measure the same quantity and should never be averaged together. 1 2 7 12 13
Estimates versus models. ABB explicitly says its 2023 figures came from questionnaires rather than accounting records. ITIC likewise describes its hourly costs as respondents' estimates. NIST scales survey responses against Census data and, in the later analysis, varies assumptions in a simulation. A published number can be accurately transcribed without being a direct observation of a stopped line's financial loss. 1 2 13 14
IT downtime wearing a manufacturing costume. ITIC's $300,000-an-hour threshold comes from research on computing and network outages. It describes IT availability and business consequences across industries, not a production-equipment survey. The Gartner-attributed per-minute claim was not verified in its origin document in this pass and is excluded. An IT figure does not become a stamping-press benchmark by being placed in a manufacturing article. 14
Sector estimates stripped of their scope. Siemens publishes $2.3 million an hour for a large automotive plant. That is not an all-manufacturing average, but it is also not identified in the report as a hard ceiling or maximum individual response. ABB's 2025 release separately says 7% estimated costs above $500,000 an hour, so $500,000 is not the maximum of that survey either. The source's own label has to travel with the number. 11 12
The $260,000 figure, and how careful to be with it
The $260,000-per-hour claim is attributed to Aberdeen in the source trail examined here. This verification pass did not retrieve an accessible original publication establishing that figure's calculation, publication date, sample or industry coverage. Its inclusion here identifies an excluded claim; it does not validate it as an average, assign it a verified age, or establish that it applies to manufacturing.
The primary-source lookup did not resolve that gap on September 12, 2026. Repetition elsewhere would not supply the missing sample, question wording or method. For a defensible hourly comparison, the verified rows above give their populations and limitations; the Aberdeen-attributed claim does not enter the downloadable numerical evidence. Its retrieval status remains separate from the verified observations.
How much downtime does a plant actually have?
L2L's 2025 U.S. survey reports 30 hours of total downtime per represented facility per month, more than half unplanned. NIST's older survey reports 7.8% of planned production time as downtime and a separate average attribution of 31.7% of downtime to reactive maintenance, using a 2016 economic basis. These answers are not interchangeable: one counts hours in represented facilities, the other reports shares of scheduled time and downtime. 1 7
The 27 hours and the 30 hours are not the same measurement
Siemens reports 27 hours a month of unplanned downtime at a large plant in four global sectors. L2L reports 30 hours a month of all downtime, planned and unplanned, at the U.S. facilities represented in its survey. The numbers look close and mean different things. Putting them next to each other without the definitions creates a range neither study actually measured. 7 11
Siemens also reports 25 downtime incidents per facility per month, compared with 42 in 2019, and 27 lost hours, compared with 39. Siemens states that comparisons between its editions are indicative only because the sector mix changes. Those published comparisons can be reported with that limitation; they are not a fixed-panel, like-for-like trend for the same plants. 11
Table 4 — Downtime as a share of planned production time, by maintenance strategy
From NIST's 2021 Monte Carlo re-analysis of its Machinery Maintenance Survey, using the study's 2016 economic basis. The measure is percent of planned production time lost to downtime, as labeled in Tables 6 and 7. The ranges below are the minimum and maximum group results across simulation iterations—not the range of individual plants and not confidence intervals. 2
| Group | Simulation mean | Simulation median | Minimum–maximum across iterations |
|---|---|---|---|
| Top 50% in reliance on reactive maintenance | 10.38% | 10.44% | 5.38%–13.17% |
| Bottom 50% in reliance on reactive maintenance | 4.91% | 5.03% | 2.40%–6.91% |
| Within the less-reactive group: lower-predictive, preventive-leaning half | 5.34% | 5.67% | 2.03%–8.33% |
| Within the less-reactive group: higher-predictive half | 4.35% | 4.39% | 1.37%–7.00% |
Source: Thomas and Weiss, International Journal of Prognostics and Health Management (2021), Tables 6 and 7, printed pages 10–11. Verified September 12, 2026. The authors describe the small-group comparisons as anecdotal. 2
The same analysis reports that the less-reactive half had 78.5% fewer defects, and that within the non-reactive group the predictive-leaning half had 87.3% fewer defects than the preventive-leaning half. These are the authors' published percentage comparisons, not percentages newly recomputed from rounded table cells. NIST flags these small-group comparisons as anecdotal evidence. They do not establish the reduction a particular plant would achieve by switching strategies. 2
A related arithmetic trap concerns the opening 2.5% figure. The calculation is 7.8 × 31.7 ÷ 100 = 2.4726, rounded to 2.5% of planned production time. It multiplies two published averages; it does not reconstruct the average of each respondent's downtime percentage multiplied by that respondent's maintenance-attribution percentage. Without those paired inputs, this page cannot claim a separately observed national rate. 1
Table 5 — Hours, incidents and frequency, with their populations
| Figure and status | Population / denominator | Period | Source |
|---|---|---|---|
| 30 hours total downtime/month; over half unplanned | Facilities represented by 600+ U.S. manufacturing leaders in 46 states | Fieldwork July 23–August 12, 2025 | L2L 7 |
| 27 hours unplanned downtime/month | Large plants in automotive, FMCG, heavy industry, oil and gas; global | Survey results April 2019–March 2023; published 2024 | Siemens 11 |
| 25 downtime incidents/month | Same Siemens large-plant population | Same survey period and publication | Siemens 11 |
| 7.8% of planned production time reported as downtime | Respondents to NIST's U.S. manufacturing survey | 2016 basis; report published 2020 | NIST Table 5.1 1 |
| 31.7% of downtime attributed to reactive maintenance, respondent average | Same survey; not a percentage of plants | 2016 basis; report published 2020 | NIST Table 5.1 1 |
| 44% at least monthly equipment interruptions; 14% weekly, nested within the 44% | 3,600 global senior decision-makers | Published October 14, 2025; fieldwork dates not stated | ABB 12 |
| 67% describe their maintenance approach as reactive | More than 600 U.S. manufacturing leaders | Fieldwork July–August 2025 | L2L 7 |
| 13.3% downtime claim — not admitted as a directly verified observation | Swedish-study claim reproduced in a literature review | Attributed to Tabikh's 2014 thesis; original not accessed | NIST's bibliographic lead only 2 18 |
Source: NIST AMS 100-34, Table 5.1 1; L2L's 2025 release 7; Siemens' 2024 report 11; ABB's 2025 release 12. The Tabikh row records an excluded literature-only claim, not a verified observation. Verification pass: September 12, 2026.
One warning on the ABB rows. ABB's 2023 and 2025 releases describe different surveys and samples: 3,215 plant maintenance decision-makers in the earlier survey and 3,600 senior decision-makers in the later one. The earlier release reports roughly two-thirds experiencing unplanned downtime at least monthly; the later release reports 44% with equipment-related interruptions at least monthly. These are not automatically two points on a comparable trend line. The releases do not establish a like-for-like decline. 12 13
Is there a government source for industrial downtime statistics?
Yes—NIST provides maintenance and downtime estimates, while Census and the Federal Reserve publish related capacity data. BLS supplies separate injury and fatality context; those records are not a measure of downtime caused by equipment failure. The source map distinguishes the measures rather than treating every industrial statistic as an outage statistic. 1 2 3 5 6 19
Table 6 — The federal source map
| Dataset / publication | Agency | What it measures | Cadence / vintage | Detail level | Where to look |
|---|---|---|---|---|---|
| Manufacturing Cost Guide figure in Annual Report on the U.S. Manufacturing Economy: 2025, AMS 100-76 | NIST | A guide-derived downtime share and dollar estimate restated in the report | February 2026 publication; not proof of annual remeasurement | Covered U.S. discrete manufacturing, NAICS 321–339 excluding 324 and 325 | Costs/losses discussion, printed page 25 3 |
| Economics of Manufacturing Machinery Maintenance, AMS 100-34; 2021 journal analysis | NIST / NIST authors | Six maintenance cost/loss components, including maintenance-associated unplanned downtime | 2020 and 2021 publications on a 2016 economic basis | Same specified manufacturing industry range | AMS 100-34 Table 8.1; journal Tables 4–5 1 2 |
| Quarterly Survey of Plant Capacity Utilization, Form MQ-C2 | U.S. Census Bureau; co-sponsored by Federal Reserve Board and Defense Logistics Agency | Actual/full capability, reasons for below-capacity operation and work patterns | Quarterly | 93 industry groups in current program documentation | Table 3b; split from former Table 3 starting Q1 2022 6 |
| G.17 Industrial Production and Capacity Utilization | Federal Reserve Board | Output indexes and output-to-capacity utilization ratios | Monthly, with revisions | Market and industry groups; manufacturing scope as defined in G.17 | Current release summary and industry tables 5 |
| Census of Fatal Occupational Injuries; Survey of Occupational Injuries and Illnesses | Bureau of Labor Statistics | Fatal injuries, and nonfatal injuries/illnesses; not an equipment-downtime cause count | Annual | Industry and event/case categories | CFOI industry-by-event tables; SOII industry incidence tables 19 20 22 |
Source: NIST reports 1 2 3; Census program documentation, current questionnaire and table-change notice 6; Federal Reserve G.17 5; BLS injury and fatality publications 19 20 22. Verified September 12, 2026.
The quarterly federal survey that asks why plants ran below capacity
Census's current QPC methodology defines the target population as domestic manufacturing and publishing establishments with five or more employees in its 93 publication groups. Its legacy overview instead says five or more production workers and 95 industry groups; those descriptions do not match the current methodology for the sample introduced in Q1 2025. This page uses the current methodology's employee threshold and 93-group coverage, with that source-version difference stated rather than hidden. The questionnaire asks plants operating below full production capability for primary reasons—not simply whether a machine stopped—and equipment limitations are one option among several. 6
Table 7 — The reasons Census asks plants to choose from
Read directly from the current Census-hosted Form MQ-C2, Item 3B, on actual operations versus full production capability. The reason text below follows the form; line breaks are normalized. Respondents may mark the primary reasons that apply, so the list is not a set of mutually exclusive outage causes. 6
| Reason as printed on the current form |
|---|
| Not most profitable to operate at full production capability |
| Insufficient supply of materials |
| Insufficient orders |
| Insufficient supply of local labor force/skills |
| Lack of sufficient fuel or electric energy |
| Equipment limitations |
| Storage limitations |
| Logistics/transportation constraints |
| Sufficient inventory of finished goods on hand |
| Strike or work stoppage |
| Seasonal operations |
| Environmental restrictions |
| Other – Specify |
Source: U.S. Census Bureau, Form MQ-C2, Item 3B, page 2, OMB control number 0607-0175; current Census-hosted questionnaire with approval expiring July 31, 2027. Verified September 12, 2026. 6
Published quarterly estimates for the reasons are available in Census's downloadable tables. Beginning with Q1 2022, the former checkbox Table 3 was split into Table 3a (change in full capability) and Table 3b (actual operations versus full capability). We checked the documentation and form but have not transcribed current-quarter Table 3b percentages. No current-quarter equipment-limitations percentage appears on this page or in its dataset. 6
Capacity utilization is not a downtime rate
Capacity utilization measures output relative to sustainable capacity, not the fraction of scheduled time a machine was broken. The difference matters even when both quantities are expressed as percentages. 5 17
Manufacturing capacity utilization was 76.0% in July 2026, against a 1972–2025 average of 78.2%, in the Federal Reserve's August 18 release. It is tempting to read the missing 24 percentage points as downtime. That subtraction does not measure time: the published ratio compares output with capacity. The manufacturing series here also has the Federal Reserve's stated coverage, which includes logging and specified publishing industries alongside NAICS manufacturing. 5
Census Form MQ-C2 tells plants to estimate full production capability using machinery and equipment already in place and ready to operate, assuming normal downtime and sustainable operating conditions. The Federal Reserve uses QPC data to benchmark monthly estimates; its own capacity definition likewise allows normal downtime. In a March 2018 analysis of earlier survey responses, the Federal Reserve found insufficient orders or demand to be the most commonly cited reason for operating below capacity. That historical finding is not a current-quarter cause breakdown, but it demonstrates why underutilization cannot simply be relabeled equipment failure. 6 17
The safety record is separate from the downtime record
Safety is a separate outcome, not a dollar-cost component to infer from these studies. BLS recorded 391 fatal occupational injuries in private manufacturing in 2023; 120 were in the table's contact-incidents category, the largest listed event category for that sector. BLS subsequently reported 353 manufacturing fatalities for 2024. None of those totals identifies fatalities caused specifically by equipment failure or unplanned downtime. 19 22
For nonfatal outcomes, private manufacturing's total recordable injury-and-illness incidence rate was 2.8 cases per 100 full-time-equivalent workers in 2023, compared with 3.2 in 2022. These are the historical years used in this comparison, not a claim that 2023 is the newest available injury data. An injury-and-illness rate is not an injury-only rate, and it is not a percentage of employees injured. 20 21
NIST's survey separately asked managers what share of injuries was associated with reactive maintenance. Table 5.4 reports an average response of 0.2% and unstratified, 2016-basis model estimates of 134.1 injuries and 0.4 deaths annually across the covered industries. The report gives 90% intervals of 0–492.7 injuries and 0–1.5 deaths for those estimates. These fractional expected counts are not observed incident totals, and the intervals include zero; they cannot establish a measured annual maintenance death toll. 1
Machinery guarding and hazardous-energy control during covered maintenance are governed by requirements including OSHA's 29 CFR 1910.212 and 1910.147. The hazardous-energy standard includes employer training requirements for authorised employees. Machine-specific maintenance belongs with trained, authorised personnel working under the applicable procedures; nothing on this page is a procedure or a substitute for those standards. 23
Which industrial downtime statistics can actually be compared?
Published industrial downtime statistics can be compared only after their definitions, populations, methods and dates have been aligned. A legitimate time comparison may use different years, but it still needs a consistent basis; an hourly estimate and an annual national total cannot be treated as the same metric. The pairings below fail those tests or require qualifications that cannot be dropped. 1 2 7 11 12 13
Table 8 — Comparisons the evidence does not support
| The comparison | Why it fails |
|---|---|
| “$222 billion is the cost of downtime.” | $222bn is the combined six-component estimate; maintenance-associated unplanned downtime is $18.4bn of it. |
| “$18.1bn in 2020 rose to $18.4bn in 2021.” | Both estimates use a 2016 economic basis. These are analytical differences, not a measured year-over-year change. |
| “A change between Siemens editions is a like-for-like change in downtime’s revenue share.” | Siemens' combined cross-edition comparisons have different sector mixes; the publisher calls them indicative only, not a fixed-panel trend. |
| “Two-thirds had monthly outages in 2023, only 44% in 2025.” | The ABB publications describe different samples and survey wording; the releases do not establish a like-for-like trend. |
| “Plants lose 27 to 30 hours a month.” | Siemens' 27 is unplanned downtime at large plants globally; L2L's 30 is total downtime in represented U.S. facilities. Not a common measured range. |
| “Downtime costs over $300,000 an hour,” used as a plant-equipment benchmark | The ITIC threshold concerns IT and server/network downtime, not a manufacturing-equipment population. |
| “Capacity utilization of 76% means a quarter is lost to breakdowns.” | The ratio measures output against sustainable capacity, which already allows normal downtime. Below-capacity operation has multiple possible causes. |
| A national downtime total allocated to a county or a single facility | The downtime sources compiled here do not supply a validated subnational allocation or facility-specific loss measure. |
Source: Greensboro Dock Door Repair Research's comparison of NIST 1 2, Siemens 11, ABB 12 13, L2L 7, ITIC 14, and Federal Reserve/Census definitions 5 6 17. Verified September 12, 2026.
What a recent publication date does and does not mean
Four kinds of date need to be kept separate. Not every publication discloses all four; a missing field stays missing rather than being filled with its publication year.
Fieldwork date—when respondents answered. L2L gives July 23–August 12, 2025. Siemens describes survey results spanning April 2019–March 2023; that is not a claim that all interviews occurred in 2024. 7 11
Economic reference year—the year the monetary basis describes. NIST's matched maintenance estimates use 2016 in both publications. 1 2
Publication date—when the publication was issued. NIST's journal article is from 2021; the annual report carrying the Manufacturing Cost Guide figure was published in February 2026. 2 3
Verification date—when this page's source and arithmetic checks were performed: September 12, 2026.
A 2026 publication can carry older estimates. Calling the $245 billion figure a number appearing in a 2026 NIST report is supported; calling it a measured 2026 downtime loss is not. The passage points to an earlier tool and does not give a measurement period sufficient to make that claim. The evidence register preserves that date gap rather than silently assigning 2016 or 2026. 3
What do the North Carolina and Guilford County figures measure?
North Carolina had 449,300 manufacturing jobs in July 2026, preliminary and seasonally adjusted, down 2.2% from a year earlier. That is an industrial footprint measurement, not a downtime measurement. The downtime sources compiled here do not support allocating hours or losses to North Carolina, Guilford County, or an individual plant. 8
Table 9 — North Carolina manufacturing context
| Geography | Figure | Reference period | Adjustment / status | Source |
|---|---|---|---|---|
| North Carolina | 449,300 manufacturing jobs | July 2026 | Preliminary; seasonally adjusted | BLS 8 |
| North Carolina | −2.2% manufacturing employment, 12-month change | July 2026 | Preliminary; seasonally adjusted | BLS 8 |
| Greensboro–High Point metro | 47,400 manufacturing jobs | July 2026 | Preliminary; not seasonally adjusted | BLS 9 |
| North Carolina | 10,210 private manufacturing establishments | 2018 annual | Historical annual establishment count | NC Commerce/LEAD QCEW 10 |
| Guilford County | 682 private manufacturing establishments | 2018 annual | Historical annual establishment count | NC Commerce/LEAD QCEW 10 |
| Randolph County | 274 private manufacturing establishments | 2018 annual | Historical annual establishment count | NC Commerce/LEAD QCEW 10 |
| Rockingham County | 82 private manufacturing establishments | 2018 annual | Historical annual establishment count | NC Commerce/LEAD QCEW 10 |
Source: BLS Economy at a Glance tables for North Carolina 8 and Greensboro–High Point 9, extracted September 11, 2026; North Carolina Commerce/LEAD D4 QCEW table, private manufacturing, 2018 annual 10. All table rows read directly and verified September 12, 2026. BLS job counts are converted from thousands to jobs.
Three cautions travel with this table. They concern the data's vintage, seasonal adjustment and geography—not a reason to turn employment into an outage estimate.
The 2018 establishment counts are historical. They are the vintage of the selected county table we retrieved. They are not current, and we do not claim they are the latest available. A current county comparison needs a newer, directly checked QCEW table with the same year, ownership category and manufacturing definition for every row. Establishments are business locations, not an inventory of machines. 10
Do not present a metro share from these mixed-adjustment figures as like-for-like. The state number is seasonally adjusted and the metro number is not. Their quotient can be calculated, but it is not a consistently adjusted metro share of state manufacturing employment. The table preserves each source's adjustment rather than silently combining them. 8 9
The Greensboro–High Point metropolitan area is not a county observation. BLS labels the 47,400 figure as metropolitan-area manufacturing employment, whereas the 682 figure is a historical Guilford County establishment count. They differ in geography, year and unit; neither is a substitute for the other. 9 10
One North Carolina connection remains useful as source context: the International Society of Automation lists a Durham address and a Research Triangle Park mailing address. The ISA Interchange article now available on Automation.com presents the 5%–20% productive-capacity claim, but supplies no empirical study or calculation establishing that range. A trade body's identity or local address is not a substitute for a documented method. The claim stays outside the verified numerical evidence. 16 24
Why do source dates and revisions matter now?
Publication years, survey periods and revision notices answer different questions about recency. The verified 2025 vendor surveys add newer evidence, while historical NIST estimates remain historical and Federal Reserve capacity data remain subject to revision. A current verification date does not make every underlying observation current. 1 2 5 7 12
Three date checks matter for this edition: whether an older cost claim's origin can be retrieved, whether a survey's methods support its stated precision, and whether an agency has announced a revision. They prevent a new page date from laundering old or undefined evidence into a current estimate.
Legacy claims need a source date, not just a fresh article date. The Aberdeen-attributed hourly claim and Gartner-attributed per-minute claim were not verified in their original documents during this pass. That means their exact dates, original scope and methods are not certified here. Neither is retained as a dated benchmark in the numerical dataset. The exclusion is more useful than attaching an assumed age to an unverified origin.
L2L discloses fieldwork dates and stated survey precision. Its release reports more than 600 U.S. manufacturing leaders across 46 states and states a ±4% margin of error at 95% confidence. That is the publisher's methodology statement, not an independent validation of a probability sample: the release does not disclose the sampling frame and recruitment detail needed for that conclusion, nor an interval around its hourly or annual cost measures. Its dateline and revision note also conflict, as documented below. The July–August 2025 fieldwork dates remain explicit. 7
The federal capacity series is subject to an announced revision. In the August 18, 2026 G.17 release, the Federal Reserve says it plans an annual revision for autumn 2026, with indexes rebased to 2022 and new manufacturing benchmark data through 2023. The July 2026 utilization figure is preliminary and can be revised; the announcement does not guarantee that this particular percentage will change. A future source check should record the revised value and release date, not merely re-date this page. 5
How was this evidence register assembled?
This is an original compilation and a set of reproducible comparisons, not a new survey. On September 12, 2026, we checked the numerical claims in this reference against the primary publications we could access, transcribed the relevant tables and recorded source-level gaps rather than filling them with secondary estimates.
What we did. We checked each retained empirical figure against its issuing agency, research author or survey publisher; distinguished source reporting from our own arithmetic; and recorded the value, unit, population, reference period, publication date, sample where disclosed, method and limitation. This was an audit of the figures in this reference, not an exhaustive census of every downtime claim on the internet. Primary-source verification means that the cited publisher actually reports the figure; it does not mean we independently audited respondents' accounting records or recreated an agency's underlying microdata.
What we opened ourselves. We inspected the relevant text and table pages in NIST AMS 100-34 and the 2021 Thomas and Weiss journal article, including the component, interval, downtime and maintenance-strategy tables; the relevant passages in the 2025 and 2023 NIST manufacturing-economy annual reports; the Siemens 2024 report and its methodology; ABB's October 2023 and October 2025 releases; ITIC's two 2024 cost-of-downtime articles; L2L's release and methodology paragraph; the Federal Reserve's August 18, 2026 G.17 release and March 2018 FEDS Note; Census's QPC documentation, table-change notice and current Form MQ-C2; both BLS employment tables; the NC Commerce historical QCEW table; the cited BLS injury and fatality publications; the accessible ISA/Automation.com article; and the cited OSHA provisions. The source register identifies the exact pages, tables and release dates. 1–24
What we did not verify from an origin document. The Aberdeen-attributed hourly-cost claim and Gartner-attributed per-minute claim did not pass primary-source retrieval. The original Tabikh thesis was not accessible in this pass, so the figure reproduced in NIST's literature review is identified as a literature-only claim, not promoted to a directly verified Swedish survey result. The underlying studies behind NIST's literature-review maintenance-cost range were not independently audited either. We reached the ISA article, but it gives no empirical method for its productive-capacity assertion. Those gaps are not repaired by agreement among secondary citations.
How we processed it. We did not pool studies, average incompatible figures, adjust dollars for inflation, convert currencies or allocate national losses to states or counties. We subtracted the six NIST component estimates, checked their totals, divided the direct-maintenance difference by the total difference, and rounded that share to one decimal place. We also show the explicitly illustrative product 7.8 × 31.7 ÷ 100, use simple ratios to explain the relative size of $18.4 billion and $222 billion, subtract 76.0 from 78.2 for a percentage-point gap, and convert BLS employment values from thousands to jobs. These are transformations of displayed inputs, not new observations.
How to reproduce the original analysis. In the component file, subtract estimate_2020_usd_billion_2016 from monte_carlo_mean_2021_usd_billion_2016 on each row. Sum the differences to obtain $28.4 billion, then divide the direct-maintenance difference of $24.3 billion by that total and multiply by 100. The component shares use the same denominator and retain negative values where a component falls. Published source precision limits the precision of the result; the displayed 85.6% is rounded, not an independently estimated probability.
How source conflicts are handled. The confidence-interval file transcribes the three differing pairs as printed. Its notes identify the additional within-publication interval conflicts and do not designate a corrected confidence interval. The $245 billion Manufacturing Cost Guide statement is retained as a source-reported estimate with an unresolved methodological bridge and unspecified economic reference year in the cited passage. Missing reference periods and undisclosed samples remain blank in numeric/date fields and are explained in the notes; missing does not mean zero. 1 2 3
Verification tiers used in the dataset. ★ means the figure or reported source discrepancy was read directly in the cited primary publication. It verifies attribution, scope and transcription, not the truth of every survey response. ● is reserved for a cited primary-source item awaiting direct re-verification; no accepted numerical record in this version uses that tier. Unverified claim leads and literature-only figures have no accepted numeric value in the evidence CSV. The exclusions are documented in this page and in the combined JSON's exclusion register rather than mixed with measured or modeled values.
What this page is. Original compilation and original arithmetic on published figures. The underlying observations belong to the organisations that collected them. We did not run a survey, measure downtime, inspect plants, independently validate a vendor sampling frame, or reproduce NIST's underlying respondent-level model. Our reproducibility claim applies to the displayed arithmetic and source comparison, not to the original publishers' entire studies.
Refresh method. Re-check the vendor reports for newer editions quarterly; check NIST publications and errata annually and when a replacement study appears; and re-read BLS employment and Federal Reserve capacity releases when those rows are refreshed. Revisit the county table before adding any current county comparison. Each refresh must record its actual source-verification date and preserve the old data version; a calendar change alone is not a data update.
What does this evidence not establish?
Many vendor figures here are respondents' estimates, while the NIST national figures are survey-based model estimates. Checking the original publication establishes what it reports, not that the inputs were independently observed, audited or representative of every facility. The limits below remain attached to the figures even when those figures are quoted accurately. 1 2 7 11 12 13 14
Self-report is not an accounting audit. ABB explicitly distinguishes questionnaire responses from actual accounting records, and ITIC describes respondents' cost estimates. NIST's questionnaire asks whether downtime is formally tracked, but the existence of that question does not establish that almost no manufacturer tracks downtime. This page makes no prevalence claim about formal tracking without a verified result for that question. 1 13 14
The Siemens global extrapolation uses a study with 181 interviews. Siemens' approximately $1.4 trillion figure is a model for the world's 500 biggest companies, not a census of those companies or a survey of 500 respondents. NIST's separate estimates use 71 retained manufacturing responses. In the 2021 article's Table 4, the reproduced $193.6 billion point-estimate total has a 90% confidence interval of $93.6–$296.2 billion; that is not an interval for the $222 billion Monte Carlo mean. The differing 2020 interval remains visible in Table 2. 1 2 11
The federal downtime figure is a model, not a national observation. NIST's $18.4 billion estimate comes from survey inputs scaled with Census economic data and analyzed through simulation. Repeating its dollar value does not establish a current annual loss, a facility hourly rate, or a verified cost for an individual outage. The reference year and coverage exclusions are part of the estimate, not optional footnotes. 1 2
IT and production downtime are separate concepts. ITIC's research concerns computing, applications and network availability. That can have manufacturing consequences, but it does not measure the same event set as the equipment and production studies on this page. The IT row is retained to make the distinction visible, not to enlarge the industrial benchmark range. 14
Nothing here establishes an individual facility's loss. The study populations contain firms and plants of different sizes and sectors. A national estimate or large-plant sector estimate cannot be multiplied by one local stoppage and called that site's actual loss. A facility-specific estimate requires its own cost definitions, operating schedule and event records, none of which this compilation collected. 1 2 11
Sector labels and samples are not automatically comparable across studies. Siemens' overall count of 181 interviews is not a sample count for each of its four sectors. ABB's two releases and L2L's U.S. survey have different populations and questions. The presence of a common word such as manufacturing does not establish matching sample composition. 7 11 12 13
No state, county or metro downtime estimate was verified in this collection. That is a limit of the evidence assembled here, not a claim that no subnational research exists anywhere. The North Carolina and metro employment figures and historical county establishment counts describe industrial footprint. They cannot supply missing local downtime hours or losses. 8 9 10
No equipment-level inference is supported. Nothing in the cited aggregate downtime evidence establishes the share originating in dock doors, dock levelers or any other individual equipment category. The safety statistics likewise do not isolate deaths or injuries caused by downtime. Treating either set of aggregates as an equipment-failure rate would require evidence not collected here. 1 2 19 22
Which figures or details could not be verified?
A named publisher is not enough when the origin document, method or relevant data cannot be checked. These are retrieval and evidence limits from September 12, 2026; the unverified numerical claims are not accepted values in the dataset.
The Aberdeen-attributed $260,000-per-hour claim. The original publication was not retrieved. This page does not certify its date, sample, method, sector coverage or status as an average; the number identifies the excluded claim only.
The Aberdeen-attributed “82% experienced unplanned downtime, 70% cited equipment failure” claims. No supporting primary document was verified in this pass. Neither percentage is included as a numerical observation.
The Gartner-attributed $5,600-per-minute claim. The original document was not retrieved. Its date, calculation and population are not certified here, and the number is not used to establish an industrial hourly-cost range.
The ISA productive-capacity range. The original ISA link now resolves to an Automation.com article by Dave Crumrine and Doug Post, dated November 22, 2011. The article contains the 5%–20% assertion, so that attribution is verified; its empirical basis is not. No underlying sample or calculation is supplied in the article. 16
The claimed $50 billion annual U.S. manufacturing downtime total. No original study or issuer calculation was verified. It is not combined with NIST or Siemens figures, nor presented as a competing measured national total.
The claimed 80% and 42% equipment-failure shares. Neither competing claim was established in an original source during this pass. Naming them here documents the exclusion; it does not establish either percentage or prove they were measured on the same denominator.
Census QPC Table 3b current-quarter percentages. The table's purpose and structure were verified, but current-quarter percentages were not transcribed. A form option labeled equipment limitations is not itself a percentage of plant downtime. 6
Current Guilford County manufacturing counts. The selected county table verified here is 2018 annual data. Current county counts were not compiled; the historical values remain labeled 2018 throughout. 10
The bridge between NIST's $245 billion and $18.4 billion downtime figures. Both are present in NIST publications, but the cited annual-report passage does not provide a reconciliation or an economic reference year for its $245 billion statement. This page does not invent one. 2 3
The date discrepancy on L2L's release. The page carries an October 15, 2025 dateline and a revision note reading “Original version: 20 May 2026.” We verified both strings but not the reason for the conflict. The methodology's July 23–August 12, 2025 fieldwork dates are recorded separately. 7
Literature-only figures reproduced by NIST. NIST's Table 1 prints a 15%–70% maintenance-cost range drawn from earlier literature and a 13.3% planned-production-time downtime figure attributed to Tabikh's 2014 thesis. We checked what the NIST table says, but not the original empirical basis of those statements; the thesis was not accessible in this pass. They are not treated as new NIST survey results or included as verified original observations. 2 18
How to cite this page
The bibliographic details below identify this reference and its data version. The underlying observations are attributed to their original publishers; the component reconciliation, source comparison and compiled tables are the work of Greensboro Dock Door Repair Research.
Publication: Greensboro Dock Door Repair Research.
Page title: Industrial Downtime Statistics: What Each Number Actually Measures.
Canonical URL: https://greensborodockdoorrepair.com/research/industrial-downtime-statistics/
Last verified: September 12, 2026.
Dataset version: 2026-09-12.
The source register supplies the original publication, table or section for each retained figure. This reference's own contribution is the assembly and documented arithmetic; it does not claim authorship of NIST, Census, Federal Reserve, BLS, NC Commerce or vendor survey observations.
What is included in the downloadable dataset?
The downloadable files contain the verified numerical evidence, the six-component NIST reconciliation, the cross-publication confidence-interval comparison and the federal source map. The combined JSON also includes formulas, source metadata, the corrected Census reason list and an explicit exclusion register; it is a mixed-source reference, not a continuous time series.
Industrial downtime evidence register — CSV. One row per accepted figure, with repeated source context preserved rather than assumed. Columns: record_id, metric, value, unit, denominator, population, geography, reference_period, fieldwork_dates, publication_date, publisher, publisher_type, evidence_type, sample, source_url, source_locator, verification_tier, verification_date, limitations. Additional fields distinguish comparator signs, economic basis, raw source values, page anchors and source conflicts.
NIST component reconciliation — CSV. One row per NIST cost component. Columns: component, estimate_2020_usd_billion_2016, monte_carlo_mean_2021_usd_billion_2016, difference, share_of_total_difference, source_2020_locator, source_2021_locator, verification_date, with the two source URLs and calculation basis. Shares are percentages of the $28.4 billion total difference and can be negative.
NIST confidence-interval comparison — CSV. One row per line item whose published interval differs between the two NIST tables. Columns: line_item, point_estimate, ci_2020_low, ci_2020_high, ci_2021_low, ci_2021_high, notes, verification_date, plus source URLs and locators. These are transcriptions of conflicting source intervals, not endorsed corrected intervals.
Federal source map — CSV. One row per source-map entry. Columns: dataset, agency, cosponsors, what_it_measures, cadence, detail_level, table_to_pull, relevance, access_url, verification_date. The map explicitly separates downtime estimates, capacity statistics and safety context.
Combined dataset — JSON. All four datasets combined, with version metadata, verification-tier definitions, the source register, exclusion notes, the Census reason list and machine-readable calculation formulas. Unverified claims do not receive accepted numeric values. The calculations reproduce this page's comparisons, not the original researchers' respondent-level models.
All files are ungated and versioned 2026-09-12. The original compilation and calculations are available under Creative Commons Attribution 4.0 International; third-party publications and underlying source material retain their own terms. This license does not claim ownership of the original publishers' observations or extend to their reports.
What questions remain about industrial downtime statistics?
The answers below keep each number attached to its definition and source. They also separate verified findings from excluded claims and data that do not measure downtime.
How much does industrial downtime cost per hour?
There is no single defensible manufacturing-wide hourly figure in this collection. ABB's 2023 release reports an approximately $125,000 median of respondent estimates; Siemens' 2024 report gives $2.3 million for a large automotive plant, not a universal average or identified hard ceiling. ABB's 2025 cost bands also include respondents above $500,000 per hour. Population, period and method determine what each number can support. 11 12 13
Does NIST say downtime costs U.S. manufacturers $222 billion?
No. The $222.0 billion is NIST's combined estimate of six maintenance costs and losses, on a 2016 economic basis, for NAICS 321–339 excluding 324 and 325. Maintenance-associated unplanned downtime is one component and comes to $18.4 billion. The larger total includes lost sales, direct maintenance and other components; it cannot be relabeled as the downtime component. 2
What percentage of production time is lost to downtime?
NIST's 2020 Table 5.1 reports a 7.8% average share of planned production time as downtime, and a separate 31.7% average attribution of downtime to reactive maintenance, on the study's 2016 basis. Their product is about 2.5%, but that calculation is not a separately measured national rate. The later simulation gives group means of 10.38% and 4.91% for more- and less-reactive respondents; the authors describe these small-group comparisons as anecdotal. 1 2
Do factories lose 27 hours a month or 30 hours a month?
The figures describe different studies, not two answers for every factory. Siemens' 2024 report gives 27 hours of unplanned downtime for large plants in four global sectors, using survey results spanning April 2019–March 2023. L2L reports 30 hours of total downtime for facilities represented in its July–August 2025 U.S. survey. Planned downtime, geography, sample composition and reference period differ. 7 11
Does capacity utilization measure downtime?
No. Manufacturing capacity utilization was 76.0% in the Federal Reserve's preliminary July 2026 estimate, but it measures output relative to sustainable capacity, not the share of time equipment was broken. That capacity concept allows normal downtime. Census also collects multiple reasons for below-capacity operation, including insufficient orders; the Federal Reserve identified demand as the leading reason in its historical analysis, not as a new July 2026 cause breakdown. 5 6 17
Are IT downtime statistics the same as manufacturing downtime statistics?
No. ITIC's 2024 claim that hourly downtime exceeds $300,000 for over 90% of midsize and large enterprises comes from computing and network availability research. Its survey covered more than 1,000 firms worldwide, with fieldwork from November 2023 to mid-March 2024. Those self-estimated IT costs are not a measured production-equipment loss. The Gartner-attributed per-minute claim was not verified in its origin document and is excluded. 14
How old is the $260,000-per-hour downtime figure?
This audit did not retrieve the original Aberdeen-attributed publication, so it does not certify a publication date or age for that claim. The original sample, industry coverage and calculation were not verified either. The figure is named only to identify an excluded source lead; it is not accepted as a dated industrial benchmark or included among the dataset's numerical observations.
Is there a government source for industrial downtime data?
Yes. NIST publishes national maintenance-associated downtime estimates for specified manufacturing industries. Census's quarterly plant-capacity survey asks for reasons for operating below full capability and publishes estimates across 93 industry groups; the Federal Reserve uses QPC to benchmark monthly capacity estimates. BLS provides separate safety context. These sources measure different things, so capacity and injury figures are not substitute downtime rates. 1 2 5 6 19
Are there verified downtime statistics for Guilford County or North Carolina?
No state or county downtime estimate was verified in this evidence collection. The North Carolina and Greensboro–High Point employment figures describe jobs; the Guilford and neighbouring-county figures are historical 2018 establishment counts. They do not measure stoppages or financial losses. None of the national downtime estimates assembled here supplies a validated allocation to a state, county or individual facility. 8 9 10
Which primary publications support these figures?
The register below identifies the original publications, exact table or section, and the source checked on September 12, 2026. Entries for unretrieved origins are labeled exclusions rather than represented as working empirical sources; the verified figures link to their issuing organisations.
1. National Institute of Standards and Technology. Economics of Manufacturing Machinery Maintenance: A Survey and Analysis of U.S. Costs and Benefits. NIST AMS 100-34. Publication date: 2020-06. Locator: Tables 5.1 (printed p. 26), 5.4 (p. 30 and following text), and 8.1 (p. 39); relevant methodology and narrative. Douglas S. Thomas and Brian A. Weiss. PDF table pages and associated text read directly. The conflicting intervals and capital-depreciation labels are preserved in this reference. Verification pass: September 12, 2026.
2. NIST authors / International Journal of Prognostics and Health Management. Maintenance Costs and Advanced Maintenance Techniques in Manufacturing Machinery: Survey and Analysis. Publication date: 2021. Locator: Data section; Table 1 (printed p. 2), Table 4 (p. 7), Table 5 (p. 8), Tables 6–7 (pp. 10–11). Douglas Thomas and Brian Weiss. Relevant PDF text and tables read directly. Table 1 is a literature review, not original empirical evidence for every earlier study it lists. Verification pass: September 12, 2026.
3. National Institute of Standards and Technology. Annual Report on the U.S. Manufacturing Economy: 2025. NIST AMS 100-76. Publication date: 2026-02. Locator: Costs/losses discussion, printed p. 25, including the Manufacturing Cost Guide attribution. Douglas Thomas. The cited passage reports $245 billion and 8.3%; it does not specify the dollar figure’s economic reference year or reconcile it with the maintenance-survey downtime component. Verification pass: September 12, 2026.
4. National Institute of Standards and Technology. Annual Report on the U.S. Manufacturing Economy: 2023. NIST AMS 600-13-upd1. Publication date: 2023-11. Locator: Printed p. 24, text below Table 3.3; publication includes updates as of November 20, 2023. Douglas Thomas. Earlier restatement of the same Manufacturing Cost Guide figures; not an independent survey. Verification pass: September 12, 2026.
5. Board of Governors of the Federal Reserve System. Industrial Production and Capacity Utilization—G.17, August 18, 2026 release. Publication date: 2026-08-18. Locator: Summary capacity-utilization table; Industry Groups; annual-revision notice; manufacturing coverage note. July 2026 values are preliminary. The dated release is retained rather than substituting a later revision through an undated current-release link. Verification pass: September 12, 2026.
6. U.S. Census Bureau. Quarterly Survey of Plant Capacity Utilization: program, current methodology, questionnaire and tables. Locator: Program overview; current methodology target population and sample design; current Form MQ-C2 Item 3B. Current methodology specifies five or more employees and 93 groups. The legacy overview says production workers and 95 groups; the reference discloses that version difference. Current-quarter Table 3b percentages were not transcribed. Verification pass: September 12, 2026.
Current methodology: target population and sample introduced in Q1 2025.
Current Form MQ-C2 (PDF), Item 3B on page 2; OMB 0607-0175, approval expires July 31, 2027.
Updated checkbox tables: Table 3a and Table 3b from Q1 2022.
Legacy overview (different population wording and 95-group description).
7. L2L. New Study: Only Half of Manufacturers Successfully Reduce Downtime. Publication date: 2025-10-15. Locator: Release findings and methodology paragraph for Beyond Breakdowns: The Impact of Manufacturing Downtime. Dateline: October 15, 2025. Revision note: “Original version: 20 May 2026.” Both strings were read; their conflict is unresolved. Fieldwork: July 23–August 12, 2025; more than 600 U.S. manufacturing leaders, 46 states. Confidence and margin-of-error statements are the publisher’s claims, not independently validated here. Verification pass: September 12, 2026.
8. U.S. Bureau of Labor Statistics. North Carolina Economy at a Glance. Locator: Manufacturing row: July 2026 jobs and twelve-month change; adjustment and preliminary footnotes. Data extracted September 11, 2026. Jobs were converted from the published thousands; state series seasonally adjusted. Verification pass: September 12, 2026.
9. U.S. Bureau of Labor Statistics. Greensboro–High Point, NC Economy at a Glance. Locator: Manufacturing row: July 2026; preliminary and seasonal-adjustment notes. Data extracted September 11, 2026. Metropolitan employment is not seasonally adjusted; it is not a Guilford County count. Verification pass: September 12, 2026.
10. North Carolina Department of Commerce, Labor and Economic Analysis Division. D4 Industry Employment / QCEW selected table: private manufacturing establishments, 2018 annual. Locator: 2018 annual, private ownership, manufacturing: North Carolina, Guilford, Randolph and Rockingham. The selected historical table was read directly. These are not current counts and are not claimed to be the latest available county data. Verification pass: September 12, 2026.
11. Siemens / Senseye. The True Cost of Downtime 2024. Publication date: 2024. Locator: Executive summary p. 3; hourly-cost discussion pp. 4–6; downtime-frequency discussion p. 10; methodology p. 15. PDF read directly. 181 completed interviews overall; reported survey-results window April 2019–March 2023. Combined cross-edition comparisons are indicative because sector mix changes. $2.3 million is a large-automotive-plant estimate, not an identified hard ceiling. Verification pass: September 12, 2026.
12. ABB / Sapio Research. Industrial downtime costs up to $500,000 per hour and can happen every week. Publication date: 2025-10-14. Locator: Survey prevalence, hourly-cost bands and sample description. Release read directly; 3,600 global senior decision-makers. Fieldwork dates not stated in the release. Weekly interruptions are included within at-least-monthly interruptions; the release also reports responses above $500,000/hour. Verification pass: September 12, 2026.
13. ABB / Sapio Research. ABB survey reveals unplanned downtime costs $125,000 per hour. Publication date: 2023-10-11. Locator: Survey description and notes to editors. Release read directly, including median and questionnaire-versus-accounting-record footnotes. July 2023 fieldwork; 3,215 decision-makers in eleven listed sectors. The full survey report was not represented as independently inspected. Verification pass: September 12, 2026.
14. Information Technology Intelligence Consulting (ITIC). ITIC 2024 Hourly Cost of Downtime Report; Part 2. Publication date: 2024-09-03. Locator: Headline findings, sample and fieldwork description; Part 2 discussion of respondent cost estimates. More than 1,000 firms worldwide overall; November 2023–mid-March 2024 fieldwork. These are IT/server/network costs, not a production-equipment survey. Verification pass: September 12, 2026.
ITIC 2024 Hourly Cost of Downtime, Part 2.
15. Origin not verified. Excluded Aberdeen and Gartner source leads. Locator: Retrieval-status entry only. No accessible original document establishing the cited claim’s date, sample and calculation was retrieved in this verification pass. No source URL or publication date is certified here. These are excluded claim leads, not numerical evidence sources. Verification pass: September 12, 2026.
16. ISA Interchange / Automation.com. How much is plant or facility downtime costing you?. Publication date: 2011-11-22. Locator: Productive-capacity assertion and article byline. Dave Crumrine and Doug Post. Original ISA Interchange address redirects to the accessible Automation.com article. The article’s assertion has no supporting empirical method; it is excluded as a measured benchmark. Verification pass: September 12, 2026.
17. Board of Governors of the Federal Reserve System. Some Characteristics of the Decline in Manufacturing Capacity Utilization. Publication date: 2018-03-01. Locator: Sustainable-capacity definition and discussion of QPC reasons for underutilization. Historical analysis, not a current-quarter breakdown of the causes of underutilization. Verification pass: September 12, 2026.
18. Original thesis not retrieved; bibliographic lead checked in NIST. Tabikh, Mohamad. Downtime Cost and Reduction Analysis: Survey Results. Master’s thesis, Mälardalen University (2014). Publication date: 2014. Locator: Bibliographic identification in NIST’s 2021 Table 1 and references, and 2023 annual-report reference 18. The original thesis was not accessible in this pass. Its empirical figure is excluded from accepted numerical observations. The working NIST documents in sources 2 and 4 establish the bibliographic lead, not independent verification of the thesis’s results. Verification pass: September 12, 2026.
19. U.S. Bureau of Labor Statistics. Table A-1. Fatal occupational injuries by industry and event or exposure, all United States, 2023. Locator: Private-industry manufacturing total and contact-incidents column. 391 fatal occupational injuries in manufacturing, including 120 contact incidents. These are event classifications, not a count of deaths caused by equipment downtime. Verification pass: September 12, 2026.
20. U.S. Bureau of Labor Statistics. Table 1. Incidence rates of nonfatal occupational injuries and illnesses by industry and case types, 2023. Locator: Private manufacturing, NAICS 31–33, total recordable cases. 2.8 injury-and-illness cases per 100 full-time-equivalent workers; not an injury-only rate. Verification pass: September 12, 2026.
21. U.S. Bureau of Labor Statistics. Table 1. Incidence rates of nonfatal occupational injuries and illnesses by industry and case types, 2022. Locator: Private manufacturing, NAICS 31–33, total recordable cases. 3.2 injury-and-illness cases per 100 full-time-equivalent workers. Historical comparator. Verification pass: September 12, 2026.
22. U.S. Bureau of Labor Statistics. Fatal work injuries declined in 2024. Publication date: 2026-04-28. Locator: Private-industry table, Manufacturing, 2024 and 2023 columns. 353 manufacturing fatalities for 2024, compared with 391 for 2023. This is safety context, not a downtime loss measure. Verification pass: September 12, 2026.
23. Occupational Safety and Health Administration. 29 CFR 1910.147—The control of hazardous energy; 29 CFR 1910.212—General requirements for all machines. Locator: Scope and employer training requirements in 1910.147, including paragraph (c)(7); general machine-guarding requirements in 1910.212. Standards consulted for the nonprocedural safety statement only. Verification pass: September 12, 2026.
29 CFR 1910.212—General requirements for all machines.
24. International Society of Automation. Contact ISA. Locator: Physical-location and mailing-location labels. Read for the Durham versus Research Triangle Park distinction only. No phone numbers, addresses or commercial contact details are reproduced on this page. Verification pass: September 12, 2026.
Greensboro Dock Door Repair Research is the independent research and reference section of greensborodockdoorrepair.com.
Last verified: September 12, 2026. Dataset version: 2026-09-12.